Market Commentary Q4 2024

Time For Cooler Weather, Falling Leaves, And—Capital Gains Distributions?

We are familiar with the adage, “Nothing is certain in life except death and taxes.” Your BFA investment committee understands that it is not what you save; it is what you keep. We have a system to minimize taxes in our client portfolios when possible. Our process includes reviewing tax efficiency when selecting our recommended investments, using asset location rules in portfolios, and assessing/minimizing our clients’ exposure to year-end capital gains distributions. (Mutual funds are required to distribute their realized capital gains by year-end.)

While it is important to never “let the tax tail wag the dog,” we consider an investment’s tax efficiency when we do our due diligence on our recommended securities. We review such statistics as the turnover ratio (the percentage of fund assets replaced in one year) and the tax cost ratio (how much taxes have consumed those percentages of investors’ assets over a trailing time period). We also consider the type of investment. For example, exchange-traded funds (ETFs), particularly those that index, are known for their tax-efficient structure, including not paying year-end capital gains distributions. Unfortunately, sometimes no suitable ETFs are available for our use in an asset class.

Asset location, or the decision of which securities should be placed in tax-deferred accounts and which in taxable accounts to maximize after-tax returns, is a crucial part of our strategy. For example, bonds and other fixed-income investments, which generate most of their returns in ordinary income, should be held in tax-deferred accounts.Now that fall has arrived, our focus turns to year-end capital gains distributions from mutual funds. Research from Russell Investments (see Figure 1) has shown market performance has no relationship to capital gains distributions, which can be short- and long-term. In fact, material (i.e., 5% or more of net asset value) capital gains distributions can happen in years when the stock market is down, which last occurred in 2022.

A screenshot of a graph

Description automatically generated

We review estimates of capital gains distributions as they become available and determine which are material. If it is a recommended fund, we can hold off on buying it until after the distribution. We can also sell those positions where it makes sense to recognize the built-up capital gains rather than take the distribution. Finally, we can do tax-loss harvesting, where we identify positions in taxable accounts that have a capital loss and swap out of those positions for 30 days. Capital losses offset capital gains and $3,000 of ordinary income in the current year and can be carried forward indefinitely for federal tax purposes.

While taxes may be inevitable, proactive planning and management can help make a significant difference. We stay committed to protecting your portfolio’s growth and helping to minimize undue tax liabilities year-round. Through thoughtful asset location, our selection process, and continually monitoring tax implications, we aim to help you navigate year-end capital gains distributions efficiently.  

Explore how we address timely tax considerations using our ongoing True Planning Cycle. Please contact us anytime if you’d like to discuss your situation and needs more in-depth.

Market Commentary Q3 2024

Do Presidential Elections Affect The Markets Over The Long Term?

In a U.S. presidential election year like 2024, headlines regarding who is leading in the polls or how a candidate fared in the latest debate tend to dominate the news cycle. Investors often equate controversy with swings in the investment markets, particularly during the primaries. Still, history indicates markets continue to grow over the long term regardless of who sits in the Oval Office. Figures 1 and 2 are courtesy of Capital Group. Figure 1 shows the 10-year growth of a hypothetical $10,000 invested in the S&P 500 at the start of each election year since 1936, with blue bars representing a Democrat winning the presidency and red bars showing a Republican as the victor at the beginning of the 10 years. Except for the 2000s, which saw the dot-com bust and global financial crisis, every 10-year period has seen growth in the S&P 500. And while growth has been somewhat higher under a Democratic president, it has averaged over 10% regardless of the president’s political affiliation.

Finally, while we use broader-market proxies for our U.S. investing and do not focus on sectors of the U.S. economy, it is interesting to see what industries would benefit if there were a blue or red wave (i.e., one party taking over the presidency as well as both houses of Congress). A Republican sweep, or red wave, could benefit banks, healthcare providers, and oil and gas companies, primarily through deregulation. A Democratic sweep, or blue wave, could boost renewable energy initiatives, industrial stimulus spending, and telecommunications projects through additional funding for nationwide broadband access.    

At Brown Financial, our investment philosophy centers on time-tested strategies that prioritize consistency rather than reacting to external influences or shifts. By continuously monitoring the markets and your portfolio, we can identify opportunities when they arise and make thoughtful adjustments to enhance returns, even during periods of uncertainty. Learn more about how our common-sense approach to investing may be able to help you achieve long-term financial outcomes.

Figure 1

A graph of numbers and a number of people

Description automatically generated with medium confidence

Figure 2


Market Commentary Q1 2024

A Global Perspective, Part Two

In last quarter’s commentary, we discussed how challenging it is to forecast which country’s stock market will outperform by looking at past returns but noted our client portfolios are allocated across the globe in bonds and stocks to potentially capture higher returns where they appear. Not only does the sheer number of overseas stocks broaden the investing landscape for our clients but they also offer the opportunity for factor investing, or focusing on those types of companies history has shown are persistent drivers of returns, such as Smaller Companies and Value. (Value stocks are shares of a company that appears to trade at a lower price relative to its fundamentals.)

The international funds in our client portfolios have benefited from these international factor exposures. Given the recent headline-grabbing performance of Large-Capitalization Growth stocks in the technology sector, investors can often overlook the strides Value and Small-Capitalization stocks have made during the past three years. Figures 1 and 2 are courtesy of Dimensional Fund Advisors, pioneers in factor investing, and show by region the one- and three-year performance differences of Value minus Growth stocks and Small-Capitalization minus Large-Capitalization stocks. Factor investing, particularly Value, was successful in overseas stocks during both time frames. Additionally, emerging market stocks had the largest margins of outperformance.   

The benefits of global diversification and factor investing may offer a valuable opportunity to help enhance your investment strategy. 

Figure 1

A graph with numbers and a number of different colored squares

Description automatically generated with medium confidence

Figure 2

A graph of a number of different colored squares

Description automatically generated

At Brown Financial, our approach emphasizes the importance of global allocation and factor-based strategies that have demonstrated resilience to help our clients pursue long-term financial success. Learn more about our investment philosophy and how it may be able to benefit your portfolio.


Dimensional Fund Advisors LP is an investment advisor registered with the Securities and Exchange Commission. Consider the investment objectives, risks, and charges and expenses of the Dimensional funds carefully before investing. For this and other information about the Dimensional funds, please read the prospectus carefully before investing. Prospectuses and returns current to the most recent month-end are available from Dimensional at (512) 306-7400 or by visiting www.dimensional.com.

Selection of funds, indices and time periods presented chosen by advisor. Fama/French indices used for Value vs Growth are: US Large Value, US Growth, Intl Value, Intl Growth, EM Value, and EM Growth. Indices used for Small vs Large are: Dimensional US Small Cap, S&P 500, Dimensional Intl Small Cap, MSCI World ex USA Growth, Dimensional EM Small, and MSCI EM.

Performance for periods greater than one year are annualized unless specified otherwise. Indices are not available for direct investment and performance does not reflect expenses of an actual portfolio. Performance data shown represents past performance. Past performance is no guarantee of future results and current performance may be higher or lower than the performance shown. The investment return and principal value of an investment will fluctuate so that an investor’s shares, when redeemed, may be worth more or less than their original cost. Average annual total returns include reinvestment of dividends and capital gains. Mutual funds distributed by DFA Securities LLC.

Market Commentary Q4 2023

A Global Perspective

Given the yo-yo returns we have seen over the past couple of years (U.S. large-cap stocks -18% in 2022/+26% in 2023, foreign developed stocks -14% in 2022/+19% in 2023, U.S. core bonds -13% in 2022/+6% in 2023, etc.), our clients can be forgiven for any resulting dizziness. History shows, however, that global investment returns can change dramatically from year to year, especially in the equity markets and by country. As our friends at Dimensional Fund Advisors (DFA) point out, “Investment opportunities exist all around the globe, but the randomness of global stock returns makes it exceedingly difficult to figure out which markets are likely to be outperformers.” Put another way, it is very challenging to forecast which country’s stock market will outperform by looking at past returns. Exhibit 1 from DFA shows the performance of 22 developed markets since 2003. (Each color represents a different country, and each column is sorted top down, from the highest-performing country to the lowest.) As you can see, over the past 20 years there has been no consistent “leader.” New Zealand posted the highest developed markets return in 2019—but the lowest in 2021. The U.S. ranked in the top five for annualized returns over the entire 20 years but finished first in the country rankings just once over that period. In nine calendar years, it was in the lower half of performers. The good news is our clients don’t have to worry about which countries will deliver the best returns in the future. Our client portfolios are allocated across the globe in bonds and stocks to potentially capture higher returns where they appear. Outperformance in one market can help offset lower returns elsewhere, helping to provide more reliable outcomes over time.

A chart of different colored squares

Description automatically generated

Exhibit 1 disclosures: In USD. MSCI country indices (net dividends) for each country listed. Does not include Israel, which MSCI classified as an emerging market prior to May 2010. MSCI data © MSCI 2023, all rights reserved. Past performance is not a guarantee of future results.

Market Commentary Q3 2023

Is this time different?

We are sometimes asked after a market downturn, “Is this time different?” While the answer historically has always been “No,” it certainly feels like a “Yes” this time, given the struggles in the stock and bond markets ever since the Federal Reserve started raising the federal funds rate in March 2022. Year-to-date through early October 2023, U.S. stocks (S&P 500) are up over 14% but are not back to their recent high. U.S. core bonds are down over 2% and have never had a third straight year of losses. Why is this? Figure 1 shows only one calendar year going back to 1977 when both U.S. stocks and bonds declined, and that was 2022. BFA clients are not alone in struggling to shake off that year, as every investor with stocks and bonds in their portfolios (the vast majority) is in the same situation.

A chart with numbers and dots

Description automatically generated

The good news is that brighter days should be ahead, which could benefit BFA clients. For example, Figure 2 shows our recommended Core Plus bond fund is set up to possibly earn over 13% if the federal funds rate drops by 1%. Most analysts and even the Federal Reserve are forecasting rate decreases this year.

A screenshot of a report

Description automatically generated

Finally, many investors are tempted to view Treasury bills, CDs, and money market mutual funds as bond replacements, given the higher yields they are currently paying. However, as rates come down, those short-term yields will decrease, and stocks, bonds, and a balanced portfolio should rebound over the next one- and five-year periods. (See Figure 3)

A graph of blue and yellow bars

Description automatically generated with medium confidence

Market Commentary Q2 2023

A Rebound In Stocks And A Pivot For Bonds

Now that we are halfway through 2023, it is a good time to reflect on the year’s first six months and identify opportunities available to our clients. The rebound in equities so far this year has been led by developed markets around the globe, with the S&P 500 (U.S. large-cap stocks) entering a new bull market, or an increase of at least 20% from its October 2022 low, along the way. U.S. small-mid cap and international stocks are up 9-10% year-to-date. But the good news doesn’t stop with equities. Total returns for bonds are also positive so far this year. The big story in fixed income is the switch from price appreciation to income as the main return driver. Also, as we get closer to the end of the Federal Reserve’s rate hikes to fight inflation, our clients have new opportunities to take advantage of more income and higher return potential, especially in bonds.

Since the Fed started raising interest rates last year, clients who have been wary of market volatility or want to park cash for upcoming spending needs have found higher rates in money market funds and bank CDs. We have helped many clients utilize TD Ameritrade/Schwab’s money market mutual funds for those purposes, and we believe they are still appropriate for short-term spending needs. However, it won’t be easy for clients who consider their money market funds as investments to maintain those higher short-term rates as longer-term rates begin to increase and eventually normalize. Also, many market analysts expect the Fed to cut rates in 2024 to counter any recession. The intermediate-term, investment-grade, taxable U.S. Core Plus bond fund in our clients’ portfolios has increased its average bond maturity. The managers feel that now is a good opportunity to focus on longer-maturity fixed income. While the Fed could still raise rates higher, the current higher yields can provide a buffer against these increases. Research has shown that the time to shift cash into core fixed income is as the Fed approaches its peak policy rate (i.e., before it pauses or cuts). Please see Figure 1 below, courtesy of PIMCO: 

A graph of a bicycle cycle

Description automatically generated

Over the typical 19-month hiking cycle, rates initially rise and cash (3-month Treasury bills) outperforms Core Plus fixed income. This occurred in 2022 when bonds had a negative return from the Fed’s aggressive rate increases. However, before the Fed reaches its peak policy rate, Core Plus fixed income allocations begin outperforming cash. As always, we are here for you if you have any questions.

Market Commentary Q1 2023

The 60-40 investment strategy has rebounded so far in 2023

The 60-40 portfolio, which is generally described as a portfolio made up of 60% U.S. large-cap stocks (S&P 500) and 40% U.S. core taxable bonds (Bloomberg U.S. Aggregate), is considered the classic investment strategy in the wealth management industry. It is based on the theory that over the long term, diversification among different asset classes should smooth out portfolio returns.  For example, bonds can help mitigate downturns in equities, while equity investors who “buy the dip” during those downturns are rewarded in any subsequent upturn. The 60-40 portfolio was down 16% in 2022 as both bonds and stocks were negative (an infrequent occurrence), leading some naysayers to predict its demise. However, the Wall Street Journal did an analysis of annual returns for that portfolio over the past 35 years (Figure 1), and the portfolio was mostly positive, averaging an annual return of 9.3% since 1988.

There is also reason to be optimistic about the prospects of the 60-40 portfolio going forward. So far this year, it is up over 5% through early April. While this is a very short time, Dimensional Fund Advisors produced the chart in Figure 2 that shows the 60-40 average cumulative returns (using 5-year U.S. Treasuries for bonds) following a decline of 10% or more.

There are a couple of differences between this traditional view of a 60-40 portfolio and BFA’s corresponding portfolio, but the outlook is the same if not better. First, our 63-37 portfolio uses more than just U.S. large-cap stocks and U.S. core bonds. We also utilize U.S. small- and mid-cap stocks, Foreign developed and emerging stocks, U.S. REITs (real estate), tax-exempt bonds, and international bonds. Second, unlike our client portfolios, no wealth management fees are applied to the 60-40 returns shown here. We believe we can outperform even taking fees into account. The BFA “Core Plus” investment process provides ample opportunities for outperformance and we are confident in the portfolio’s future. 

Financial Planning Concepts

UNFORTUNATE ESTATE PLANNING MISTAKES IN WEALTHY FAMILIES

In 2002, Harvard University published a book by their then Senior Philanthropic Adviser, Charles W. Collier, called Wealth in Families. It contains several important considerations for passing wealth through generations of families.

“Shirtsleeves to Shirtsleeves in Three Generations”: Missing Purpose

Our first goal in the wealth transfer process should be to support the next generation by helping them discover a calling that will enhance their personal fulfillment and happiness through work. Collier quotes Jay Hughes, Jr., author of Family Wealth: Keeping It in the Family, as saying “In every culture that I’ve encountered – in China, Latin America, and Europe, for example – I run into the same proverb… The proverb means that the first generation makes the money, the second generation preserves it, the third generation spends it, and the fourth generation must re-create it.” According to Hughes, without the experience of work, the third and fourth generations dissipate the wealth because they lose the incentive to work. He says, “Work in its deepest dimension equates to a calling. Discovering your calling is the most important task an individual can undertake”. 

Lack of Communication

A second fundamental goal in the transfer of wealth should be more communication. Collier says, “People are often secretive about family wealth.” Of course, the silence breeds mistrust and misinformation and a lot of time and energy is spent by the family trying to find out the secrets! “More communication is almost always better. Talking to your children early about the meaning and purpose of your family wealth can also enhance your relationship with your children.” The larger the estate, the more significant the importance of discussing your family’s greater vision for the wealth while you are still here. To add purpose, philanthropy should be a critical part of this discussion.

Lack of Experience

Finally, Collier recommends providing the next generation with a pre-inheritance experience. It is a common refrain among wealthy families where the first generation intends to pass the accumulated wealth but they never prepare the children for receiving the wealth. It is a bit like inheriting a football and the next day being expected to start as quarterback for the Green Bay Packers! It doesn’t go well. “They need the freedom to take risks, to make mistakes, and, often, to fail. One approach is to give them a modest amount of money outright at age 21, or 25, monitor their progress, and then give them the balance of the financial inheritance around 35 to 40, often in trust.” Robert Coles, author of Privileged Ones: The Well-Off and Rich in America, takes it one step further by saying, “I feel strongly that parents should not give their children a significant financial inheritance during their career-building years, say ages 22 to 35.” He thinks they shouldn’t receive most until around age 40. “They need to make it on their own if they’re going to achieve any kind of competence,” he said. When combined with an individual purpose and family communication, a little experience can go a long way. 

Market Commentary Q4 2022

What effect does being out of the market have on my portfolio return?

Given the challenging year we have all gone through in both the equity and fixed-income markets, it is sometimes human nature to focus on the short term, particularly when it comes to negative returns. However, your BFA investment committee has been through every market environment since the mid-1990s and understands that the markets reward patient investors. First, be very careful in evaluating performance on a short-term basis. If you focused solely on your portfolio’s losses in 2022, you would have overlooked the positive prior three years’ returns. Second, put away any desire to “cash out” to avoid further investment losses, particularly during those periods when volatility is at its greatest and it seems the market only goes down each succeeding day. Missing consecutive days of strong returns by cashing out can dramatically impact your portfolio’s overall performance, especially in its equities.

Our partners at Dimensional Fund Advisors (DFA) looked at the growth of $1,000 in the U.S. equity market over the past 30 years both by all-cap (the Russell 3000, from 1997-2021 in Figure 1) and by large-cap (the S&P 500, from 1991-2020 in Figure 2) including being out of the index (market) over the best week, month, etc. As you can see from the following DFA graphs, the results are sobering. It is too late to decide on a course of action when you are in the midst of the storm, so it is good to have a plan already. You can trust your BFA investment committee and rely on your financial plan to help you avoid these mistakes.

Figure 1 (Russell 3000 Index)

Figure 2 (S&P 500 Index, January 1991 – December 2020)

Financial Planning Concepts

WHAT YOU NEED TO KNOW ABOUT SECURE ACT 2.0

On December 23, 2022, President Biden signed into law a $1.7 trillion budget bill that reshapes retirement savings legislation in the U.S. Secure Act 2.0 (“the Act) makes several changes to retirement plans like 401(k), 403(b), IRA and Roth IRA accounts to encourage Americans to save more for retirement. Here are four things that could directly impact your retirement plan strategy:

Required Minimum Distribution Age Increased to 73

Savers in retirement plans are required to make distributions from their tax-deferred savings (401(k)’s, IRA’s, 403(b)’s, etc.) plans when they reach a certain age, previously 72. The new legislation starts with one of the most important of all the provisions by increasing the age at which a minimum distribution is required to 73 from 72 starting in January 2023. It doesn’t help much if you were 72 or older in 2022 but if not, you have one more year before you must begin distributions. In ten years (2033), the Act will move the RMD age to 75.

As a bonus, the 50% tax penalty for failing to withdraw your RMD has now been reduced to 25% in all cases or even to 10% if you take the necessary RMD by the end of the second year.

Emergency Expense Withdrawals from 401(k) and 403(b) Plans

The new legislation now allows an “emergency” distribution from retirement plans. The maximum distribution of $1,000 may be taken once each year. It will not be subject to the 10% penalty typical of withdrawals before age 59 ½ but the money must be repaid within a specified period or no more withdrawals will be allowed for three years.

Catch-Up Contributions Increased

In 2022, savers who are 50 years old or older may make additional contributions to their retirement plans. In 2023, these participants in 401(k), 403(b) or Thrift Savings Plans may defer as much as $22,500 to their retirement savings plus an additional $7,500 catch-up contribution for a total of $30,000. The new Act increases those limits in 2025 for employees aged 60-63 to the greater of $10,000 or 150% of the standard catch-up rate adjusted for inflation. One additional important change occurs in 2024 when ALL catch-up contributions for employees with incomes above $145,000 will be required to be deposited into a Roth account.

Qualified Charitable Distribution (QCD) Limits Set to Increase

Qualified Charitable Distributions are tax-efficient gifts made by those over age 70 ½ directly to charity from an IRA. The distributions are not taxable and help satisfy the required minimum distribution. QCDs are capped at $100,000 per person per year. But starting in 2024, the QCD limit will be adjusted for inflation. Finally, in the past, QCDs were mostly limited to gifts directly to charity. But starting in 2023, the Act allows a one-time gift of up to $50,000 to charitable remainder annuity trusts, charitable remainder unitrusts, or charitable gift annuities. This may be a tax-efficient way to create a lifetime retirement income stream while benefiting a charity at the same time.

As we review your plan, we’ll let you know how Secure 2.0 can help.

Market Commentary Q3 2022

What impact could the mid-term elections have on stocks?

Many political and market commentators have been issuing forecasts and analyses regarding the Federal elections in November, particularly the prospect of Republicans taking control of the U.S. House of Representatives and the Senate. While BFA does not take political positions and leaves it in the hands of those better-suited for such prognostications, we know what history has to say about how stocks can act during the lead-up to and the year following mid-term elections, regardless of which party is in control.

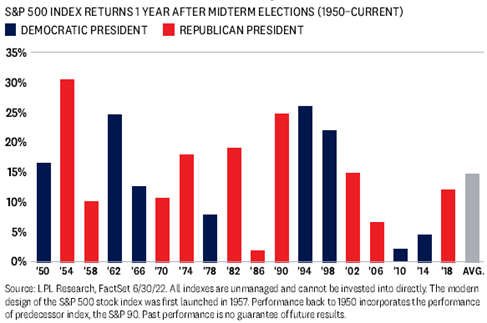
In their 2022 Midyear Outlook, LPL Research reports that mid-term election years have not been kind to equities. In the midterm years since 1950, the S&P 500 (U.S. large-cap stocks) has experienced the largest peak-to-trough pullback (down 17.1% on average) during the four years of the Presidential cycle. Indeed, the S&P 500 on a total return basis was down 24% YTD through September 30, 2022. The good news, however, is that once the uncertainty of the election is over after Election Day, stocks generally rebound, and by quite a bit. As shown in Figure 1, the S&P 500 has increased each year after every midterm election since 1950. The average gain is 14.5%.

Figure 1. This chart shows that the S&P 500 has increased each year after every midterm election since 1950. The average gain is 14.5%.

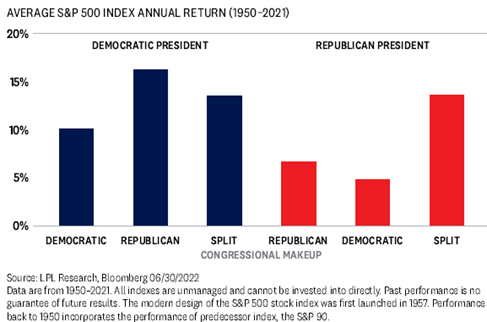
Furthermore, does it matter which political party is in control? The answer is No.  As seen in Figure 2, the S&P 500’s average annual return since 1950 has been positive, regardless of the party in the White House or the makeup of Congress. In fact, the market seems to prefer a divided government, which may be the result after November. Your BFA Investment Committee is not worried about the outcome.

Figure 2. This chart shows that the S&P 500’s average annual return since 1950 has been positive, regardless of the party in the White House or the makeup of Congress.

Financial Planning Concepts

TAX INCENTIVES FOR CLEAN ENERGY INVESTMENTS

On August 16th, President Biden signed into law new tax legislation commonly called the “Inflation Reduction Act of 2022.” The legislation includes tax incentives for businesses to invest in clean energy projects and for individual/family taxpayers who spend money on energy-efficient products. The business tax incentives are easily the most extensive portion of the new tax law but there are a few opportunities for individual taxpayers, too. 

Clean Vehicle Credits

The new legislation changes the tax incentives for purchasing an electric vehicle (EV). First, there is a transition period where if the vehicle is purchased before August 16th but is not delivered until after, the EV tax credit is based on the prior law: a tax credit of $2,500 + $417 for every kWh over 5 kWh with a maximum credit of $7,500. If the vehicle is purchased after August 16th but before 2023, the EV must also qualify under a new rule called “final assembly”, a requirement that the final assembly of the vehicle must occur in the United States. There is a 200,000 vehicle sales cap in 2022 and many manufacturers (Tesla, GMC, and Chevrolet) have already phased out. You can find a great resource for additional information here: https://www.efile.com/electric-vehicle-car-tax-credits/

It is important to note that in 2023 there are additional qualifying thresholds that relate to the battery components and critical mineral sourcing for new cars. Because of these additional requirements, far fewer cars qualify for the full tax credit. However, some used cars will become eligible for a tax credit that is 30% of the sales price up to $4,000.

Residential Energy Property Expenditures

There are new credit thresholds for “Residential Energy Property”: geothermal heat pumps, small wind turbines (less than 100 kW), solar water heaters, solar panels (photovoltaic systems), residential fuel cell and microturbine systems, biomass stoves with 75% efficiency ratings, and qualified battery storage technology (residential and >3kWh). In 2022, there is a 26% tax credit for systems placed in service before 1/1/2023. After 2022, there is a credit for 30% for 2023-2032, 26% for 2033 and 22% for 2034.

Qualified Energy Efficiency Improvements

Starting in 2023, there is a tax credit equal to 30% of the costs of all eligible home improvements up to $1,200 per year. The annual limits for specific types of qualifying improvements will be: $150 for home energy audits, $250 for any exterior door ($500 total for all exterior doors) that meet applicable Energy Star requirements and $600 for exterior windows and skylights that meet Energy Star most efficient certification requirements. There is a $600 credit for other qualified energy property including central air conditioners, electric panels and certain related equipment, natural gas, propane, or oil water heaters and furnaces. There is a $2,000 credit for heat pumps and heat pump water heaters, biomass stoves and boilers. This category of improvement is not limited by the $1,200 annual limit on total credits or the $600 limit on qualified energy property. Please consult your tax advisor regarding car purchases, property credits and improvements.

Market Commentary Q2 2022

TALK OF RECESSION, PART TWO

High inflation readings and a hawkish Federal Reserve continued to spook the fixed income and equity markets during the second quarter of 2022. The risk of recession is a distinct possibility as consumers have begun scaling back on purchases, mainly in goods and to a lesser degree in services, and dipping into savings to cover essential items such as groceries and gasoline. But what is the definition of a recession, and how do some experts predict its onset with such certainty? Let’s address the last question first. The answer is that it is impossible to know when a recession will start, so be wary of experts and their predictions.

The National Bureau of Economic Research (NBER) is responsible for placing dates on when a recession has started and when it has ended. Thus, a recession could technically end before the NBER confirms it even started, much like the pandemic-induced recession of 2020. According to the NBER, “A recession is a significant decline in economic activity spread across the economy, lasting more than a few months, normally visible in real GDP, real income, employment, industrial production, and wholesale-retail sales. A recession begins just after the economy reaches a peak of activity and ends as the economy reaches its trough.” One measure of a recession touted by the media is when the country’s Gross Domestic Product (GDP), or the value of the goods and services it produces, declines for two straight quarters. Some economists are predicting a decline in GDP for April-June 2022, which would mean two consecutive quarters of decline. However, the current job market is resilient, and unemployment is at its lowest rate in years. This robust employment is contrary to every recession since World War II, with each of those economic downturns experiencing a rise in unemployment. And, even if a recession has already started or will soon, many economists believe it will be short and relatively mild. 

WHAT DOES THIS MEAN FOR MY PORTFOLIO?

The stock market is a leading economic indicator. It is too late to make drastic allocation changes or shifts in the portfolio to avoid the adverse effects of an economic decline. However, in anticipation of an eventual economic downturn, your BFA investment committee has re-positioned our client portfolios over the past few years. These shifts included a reduction in over-valued U.S. small-cap stocks in favor of Emerging Market equities with a value tilt. Value stocks tend to hold up better than growth stocks during a recession. Also, U. S. small company stocks are more sensitive to economic changes and have historically underperformed larger company stocks going into recession. We also picked up yield and thus boosted returns by increasing our allocations to U.S. High Yield Bonds and U.S. Real Estate (REITs). And, even though interest rates have picked up, your BFA fixed-income portfolio will benefit over the next few years from rising coupons as income becomes a more significant part of bonds’ total return. Finally, history has shown that the markets should fully recover from an economic downturn.

Financial Planning Concepts

AN ANTIDOTE TO VOLATILITY? TRY TAX PLANNING

Brown Financial True Planning Cycle (TPC)

In a June 10th, 2022 article in Kiplinger Online, Rocky Mengle and Joy Taylor say, “Americans are facing a long list of tax changes for the 2022 tax year. Smart taxpayers will start planning for them now.”1 In fact, smart investors also use times of volatility to both reduce their taxes, now and in the future, and enhance their after-tax returns. During the fall semester of the True Planning Cycle (TPC), Brown Financial is laser-focused on providing tax planning strategies that provide both benefits to our clients. Here are a few notable methods you should expect during your upcoming tax review:

Tax-Loss Harvesting: During times of volatility, BFA begins to frequently and actively review portfolios for opportunities to capture tax losses. By selling positions that have declined and reinvesting the proceeds in similar (but not identical) investments, you can avoid future capital gains taxes and even write off an additional $3,000 per year from your ordinary income while remaining invested. So far, BFA has captured almost $4.5 million of tax losses, resulting in nearly $1 million in tax savings for our clients!

Roth Conversions: Roth IRAs provide tax-free growth and tax-free distributions throughout the life of the account, even after your heirs receive them. Unfortunately, most of us have more in traditional IRAs than in Roth IRAs. To “convert” a traditional IRA to a Roth, you must make a taxable distribution from the IRA that will raise your income taxes for the year. However, market declines create opportunities to buy into the Roth account while the market is low. Converting during market drops builds in a quick recovery of your taxes in a tax-free account. It may take a few years to break even on the taxes, but converting your Roth when the market is down can be a great strategy, especially if you are planning for multiple generations.

Avoid “Extra” Taxes: The IRS is sneaky, if you haven’t noticed. As evidence, there are three additional “taxes” that do not show up in the “brackets”: Net Investment Income Tax (NIIT = 3.8%), additional Medicare Taxes (0.9%), and Income-Related Monthly Adjustment Amount (IRMAA) for your Medicare Part B premium. Although none of these taxes fall within the tax “brackets,” they all apply when your taxable income exceeds certain thresholds. However, there are ways around these taxes, and strategies to avoid them should be part of your tax plan every year. As we run your analysis, we will consider the impact of these individual taxes on your overall plan and offer ideas to lower them, too. We will help you become one of the “smart taxpayers” Mengle and Taylor describe and help you save money in 2022 and beyond. We look forward to assisting you!